Statistics
Statistics of user program
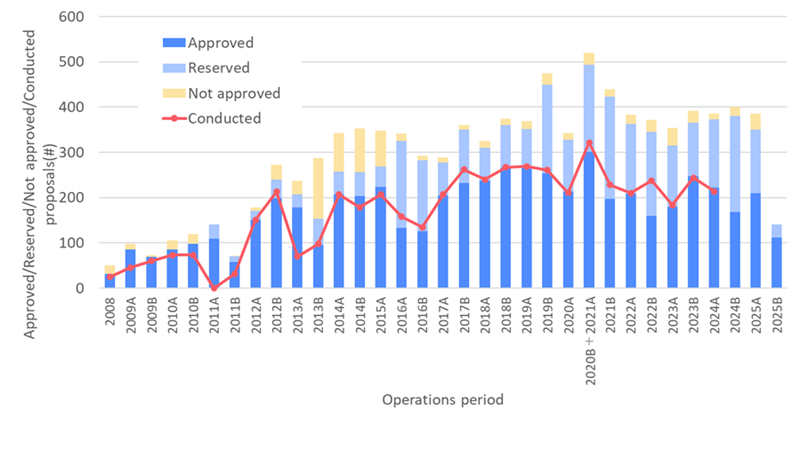
1. The number of submitted proposals (short term)
2. The number of approved proposals (short term)
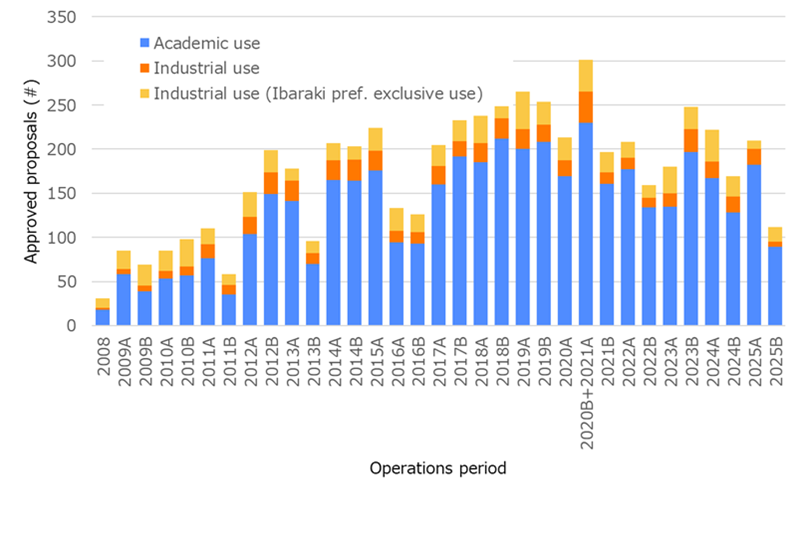
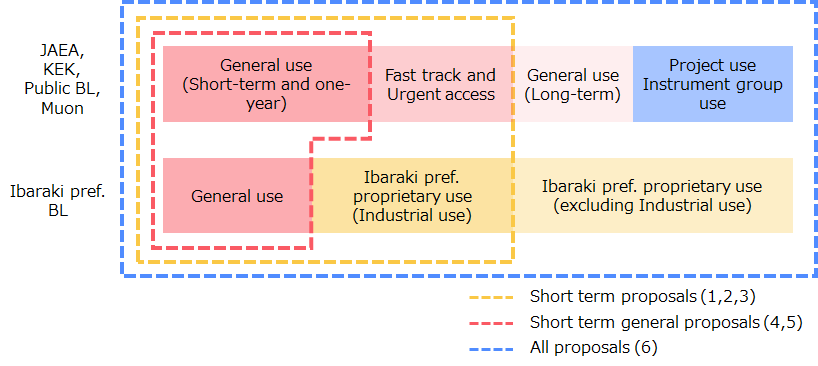
※ Proposals are classified with the following criteria.
- Industrial use: PIs belonging to private companies or P7 sub-committee
- Industrial use (Ibaraki pref. exclusive use)
- Academic use: Other than the above
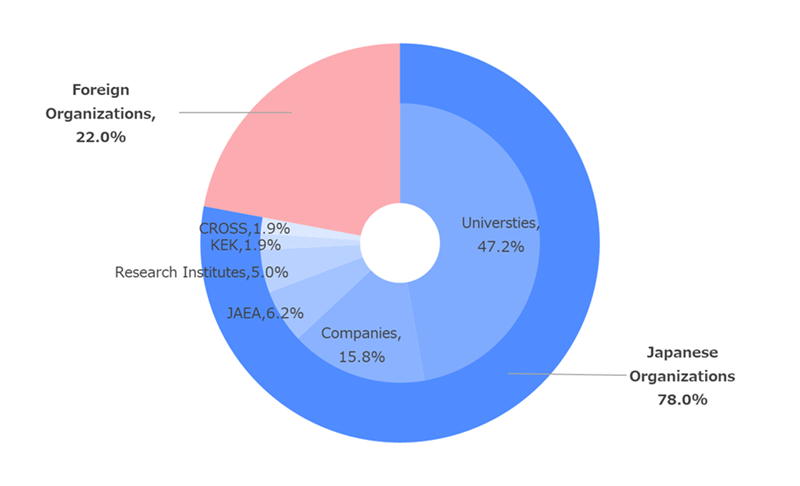
3. The breakdown for PI’s affiliation of approved proposals
short term at JFY2025
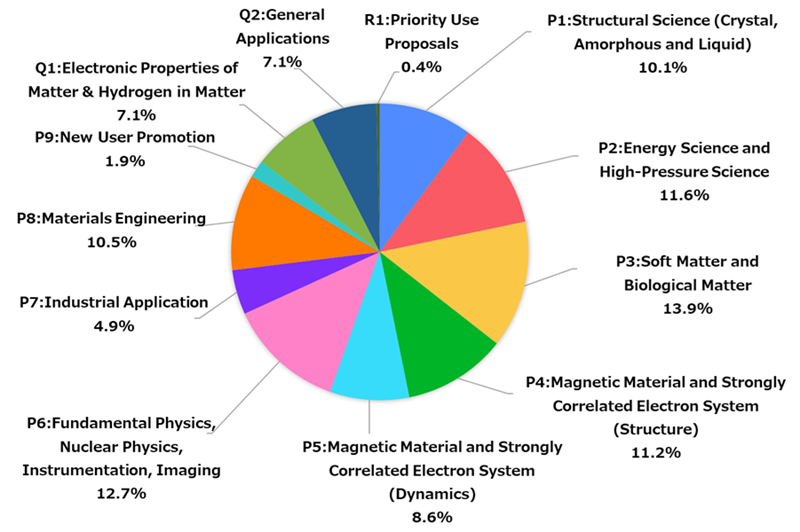
4. The breakdown for sub-committee of approved proposals
short term general proposals at JFY2025
5. The proposal success rate in J-PARC MLF (Short term general proposals)
6. The number of unique users in J-PARC MLF (All proposals)
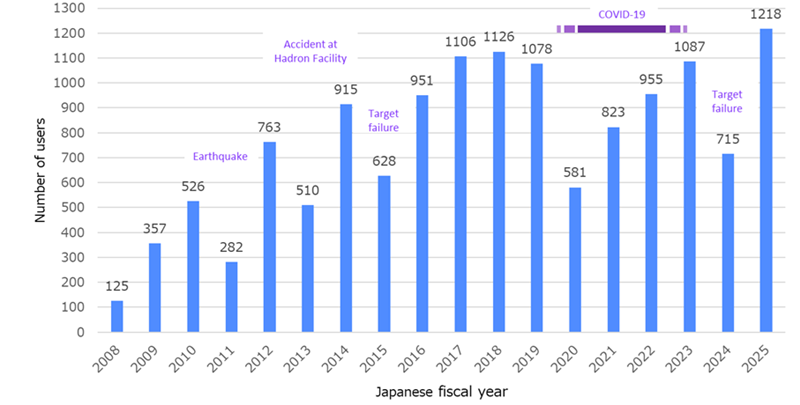
※ The number of unique users: Number of issued personal dosimeters.
※ The coverage of statistics of user program is as follows.
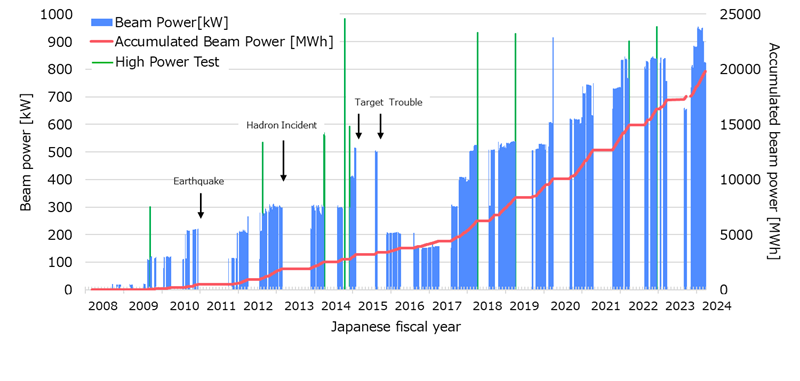
Statistics of beam operation
1. Beam power history at MLF
Statistics of achievements
1. The number of publications and top 10% most cited papers
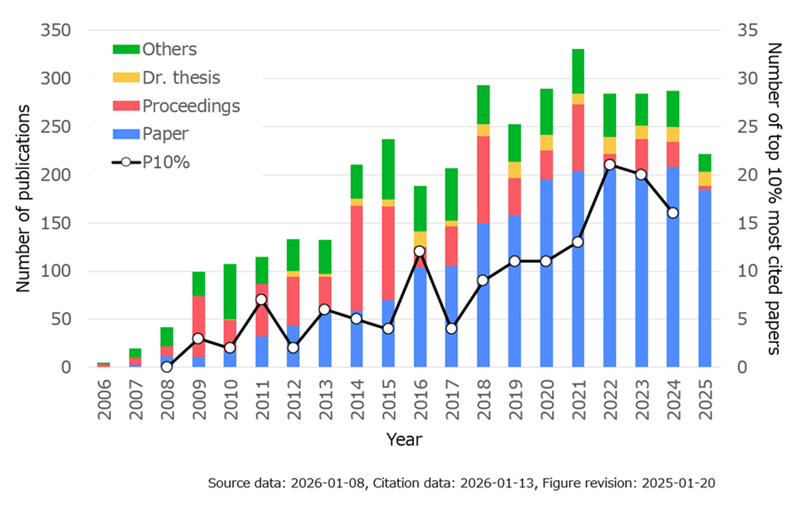
※ Achievements are classified with the following criteria.
- Paper: English peer-reviewed articles recorded in Web of Science
- Proceedings: English peer-reviewed proceedings
- Dr. thesis
- Others: Japanese articles, not peer-reviewed English articles, articles in bulletin, Master thesis, etc.
※ P10% means the number of the top 10% most cited papers among the papers in the same category, year, and document type (the details will be described later).
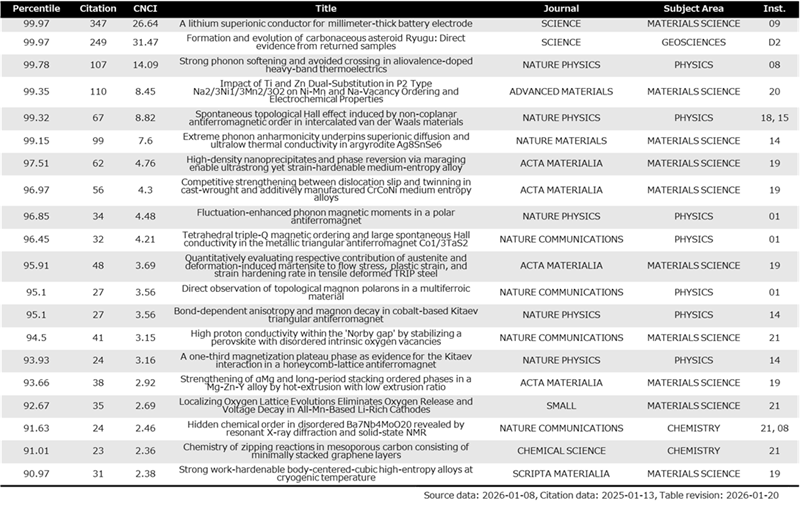
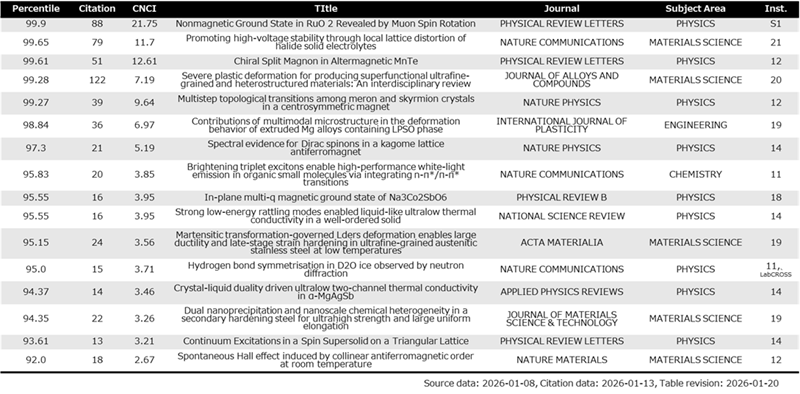
2. MLF top10% most cited publications
Publications in 2023
Publications in 2024
3. Publication rate (short term proposals)
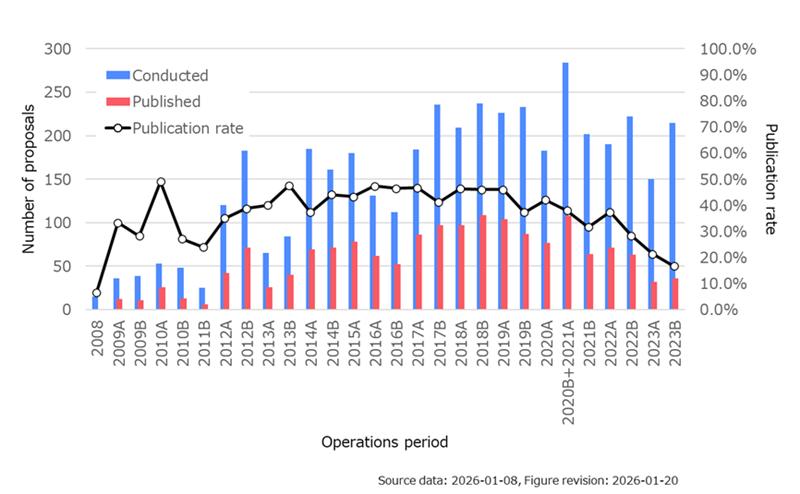
※ Publication rate means the ratio of the number of short-term proposals (except Ibaraki pref. Industrial use) having contributed to publications of English peer-reviewed papers and proceedings to the number of the conducted proposals.
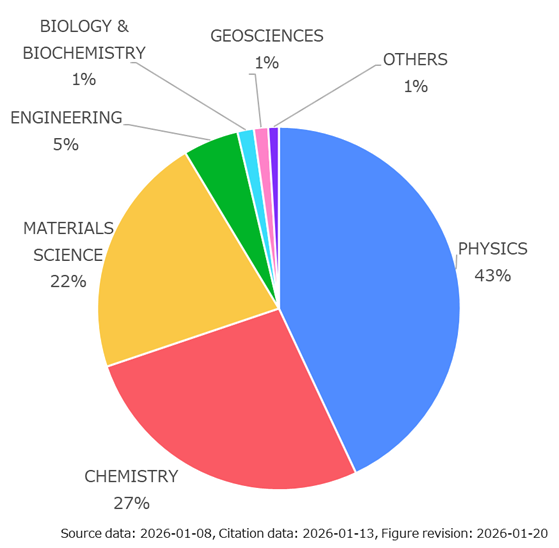
4. The proportion of research areas of publications (2006-2025 total)
Regarding citation analysis
All citation analyses were performed based on the bibliometric indicators and research areas given by the Web of Science (WoS) and InCites except for the definition of classification of achievements in “The number of publications and top 10% most cited papers”. In the analysis, papers recorded in WoS and having Digital Object Identifier (DOI) were used as the parent population.
Glossary
The Category Normalized Citation Impact (CNCI) of a document is calculated by dividing the actual count of citing items by the expected citation rate for documents with the same document type, year of publication and subject area.
Percentile means that in which the paper ranks in its category, document type and database year, based on total citations received by the paper. The top ranked documents will have the highest percentile.
Documents in the top 10% will be in the 90-100 percentiles.
See Indicators and Calculations in InCites Help Center for details.
※Figure version number
- Source data: the updated date of the database used for the analysis.
- Citation data: the updated date of citation analysis collected from Web of Science, etc.
- Figure or Table revision: the updated date of the figure or table.
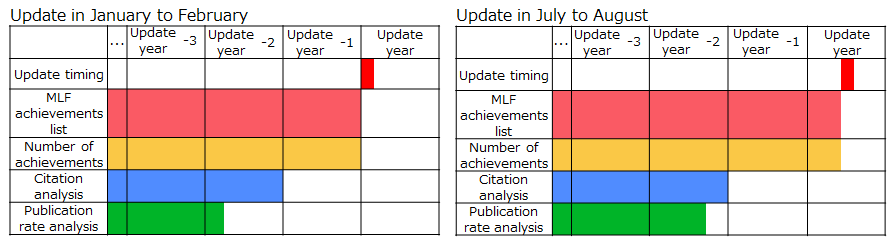
The period used for the achievement analysis
The correspondence between analysis and indicators
- Citation analysis: CNCI, Percentile, P10%.
- Publication rate analysis: the number of proposals having contributed to publications of papers and proceedings, the publication rate.
The target period of the analysis
- The number of achievements: the latest data is applied.
- Citation analysis: the data more than 1 year after the publication is applied according to the NISTEP report (※). The data is calculated per one year.
- Publication rate analysis: the data of proposals more than 2 years after the experiment is applied because it takes typically 2 years to publish the paper after the experiment. The data is calculated per operations period (normally half a year).
※ Reference: NISTEP “Benchmarking of Scientific Research 2017” 2-2(1)